Uncertainty Color Palettes
Nearly all the data that we work with has an element of uncertainty to it. For example, the next generation sequencing datasets that I worked with for my undergradaute research are inherently noisy. However, when we visualize expression level data, we often disregard the uncertainty around a measurement and simply represent it as a mean (i.e. ignoring the variance among technical replicates). I wanted to see if there was work being done on representing uncertainty graphically.
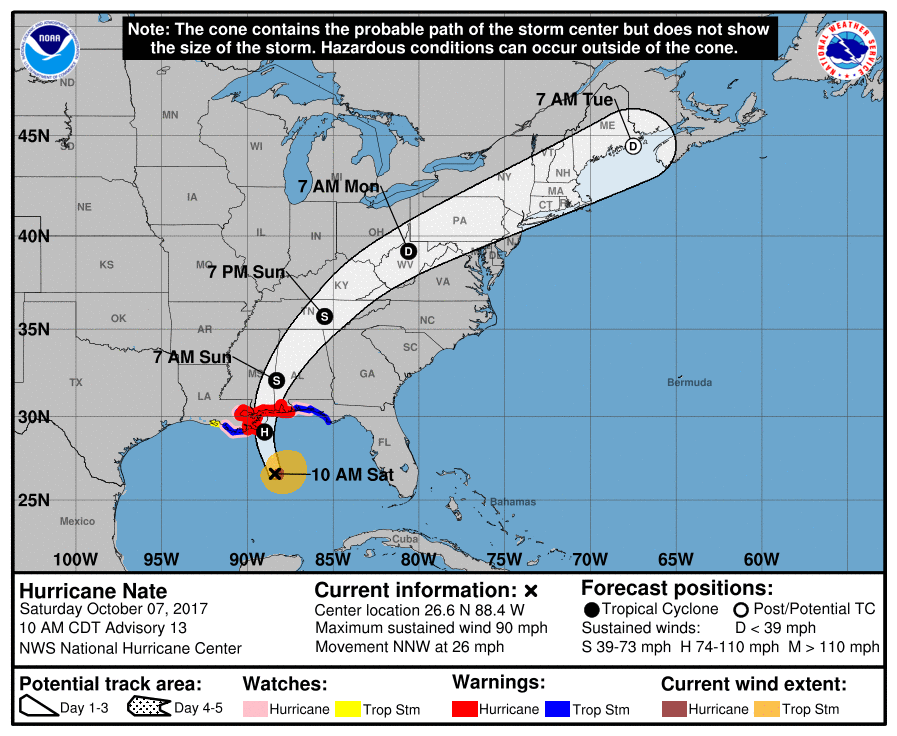
The canonical example of uncertainty in visualization for a Floridian like me is hurricane forecasting cone. When I was a kid, I was under the impression that the cone represents the size of the hurricane as it grows while going through the Gulf of Mexico. There are so many different dimensions of uncertainty in hurricane forecasting and this needs to be accurately conveyed so people can make appropriate decisions on how to protect their property in the face of a hurricane.

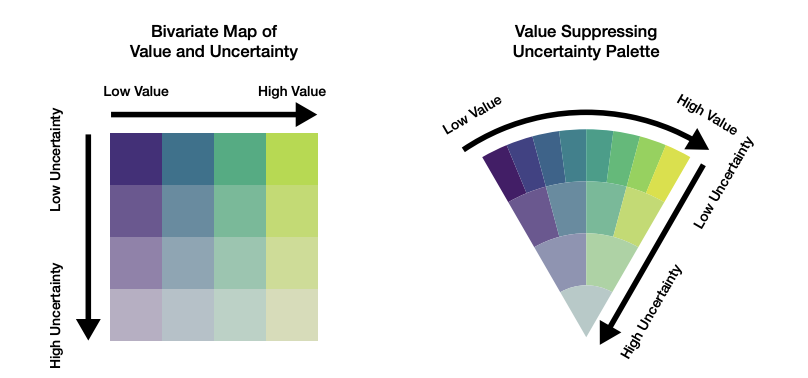
Since a common method of encoding data is color, I read this paper called “Value-Suppressing Uncertainty Palettes” by Correll, Moritz, and Heer from University of Washington. Correll et al present an alternative color palette for encoding uncertainty. The palette on the left is encodes uncertainty on another dimension independent dimension. The proposed value suppressing uncertainty palette on the right will leader to the same color for both ends of the color spectrum. This makes intuitive sense because if there is really high uncertainty, then the number (mean) doesn’t have any additional value to the decision maker. Therefore, it should be ‘greyed’ out.

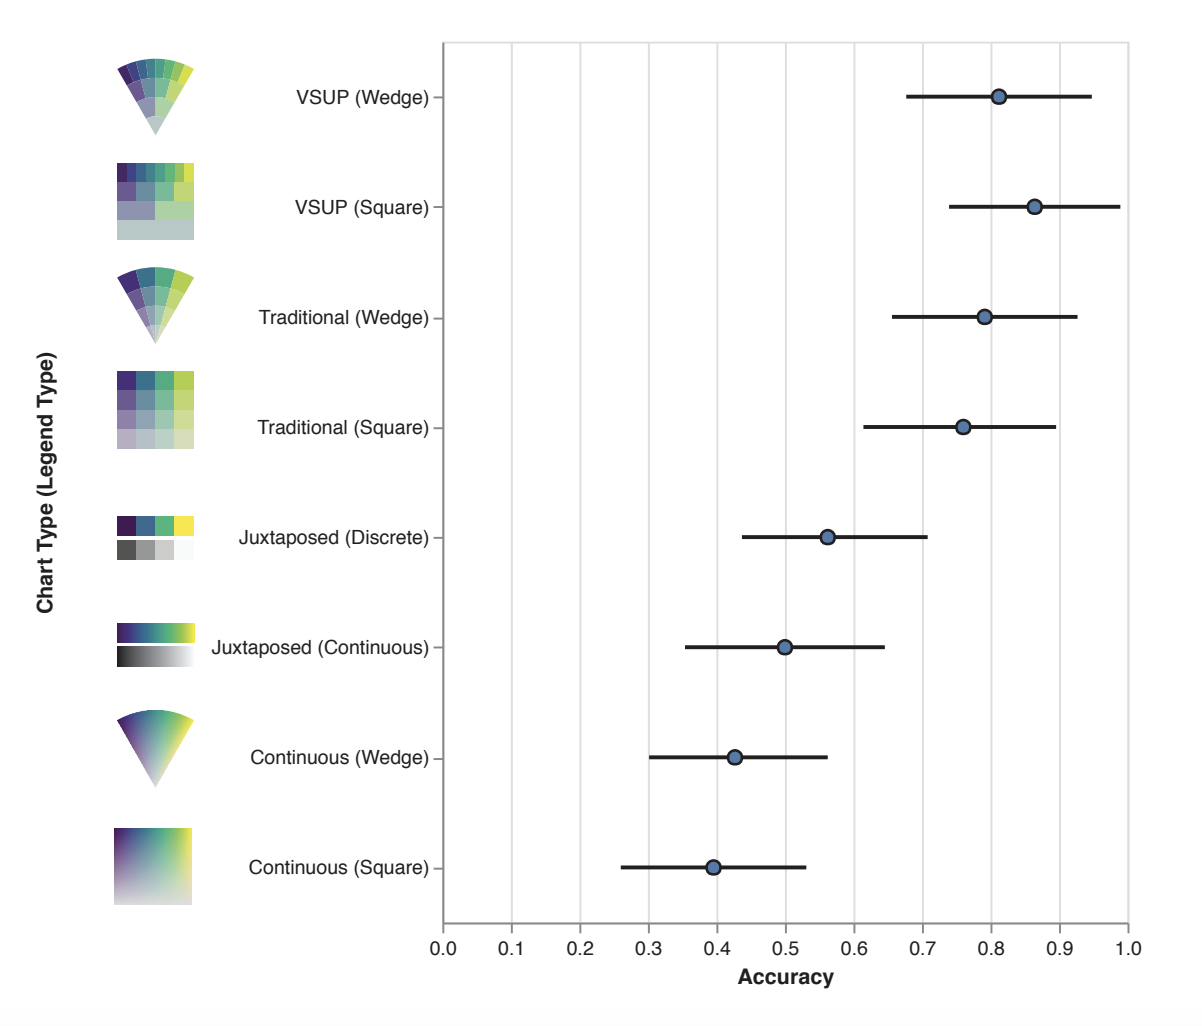
The authors then wanted to compare their proposed value suppressing palette with other possible palettes to encode the data. They did two experiments to understand the performance of their palette. Below are the results of the experiment where the authors asked the users (which are sampled from a representative population) to identify a pair of (value,uncertainty) squares on a given heat map.

The results suggest that a discrete palette (with few bins) with the uncertainty and value on the same palette performs the best.