Trying-to-Find-Data
Is it easy to find data? If you recall from last week’s post, I found a dataset on the Miami-Dade County’s School District website that detailed the percentage of each school that has free-or-reduced lunch. Also, note that school kids get free nutritious breakfast for FREE every school day. Having two meals a week covered for your children can be a lifeline if budgets are tight. What happens when summer comes around? Little background about me. I came to the United States when I was 6 years old with my mom and my 8 year old brother. We came here on an H-4 visa, meaning that we were dependents of my father who had come here three years before to find work! The government does not grant these H-4 visas unless there is sufficient family income to live ‘comfortably’ in the United States. My summers were not spent in sailing camps in Maine, or on lavish vacations in Canada. The reality is that summers can be a financial burden for many people. At the minimum, during the school year, public school provides quality childcare, and two meals. Miami-Dade is among the most unequal districts in the United States. Take a look at a graph produced by the Wonk Blog on the Washington Post.

With income inequality at this scale comes spatial inequality meaning that the rich live close to the rich and the poor live close to the poor. Maybe Key Biscayne is a good example of this.
The challenge this week was making my dataset. I originally thought that I would have to google each school and manually enter the longitude and latitude.

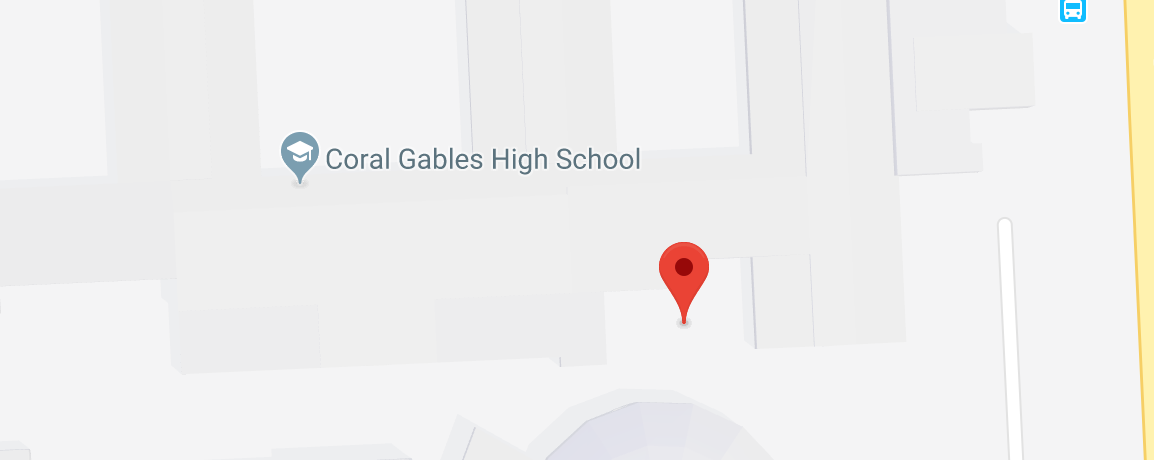
I would Google Maps the school and click immediately adjacent to the pin. Then copy and paste the data into a spread sheet. After doing about five schools, I realized that there had to be a better way? There could have been an applet that let me input a list of locations and I could just choose the result on google maps for each. Then, an aggregate list of longitude and latitudes could be spit out. I couldn’t find such an applet, but I definitely want to make one in the future. I searched around and found the the list of Miami-Dade Schools and their longitude and latitudes the Open Data Portal run by the Miami-Dade County website. Allows you to explore the data with their online tools before you download.

After playing with the map for a bit, I downloaded the data as a ‘csv’ which means that the entries are separated by commas.
library(readr)
Public_School <- read_csv("Downloads/Public_School.csv")
View(Public_School)

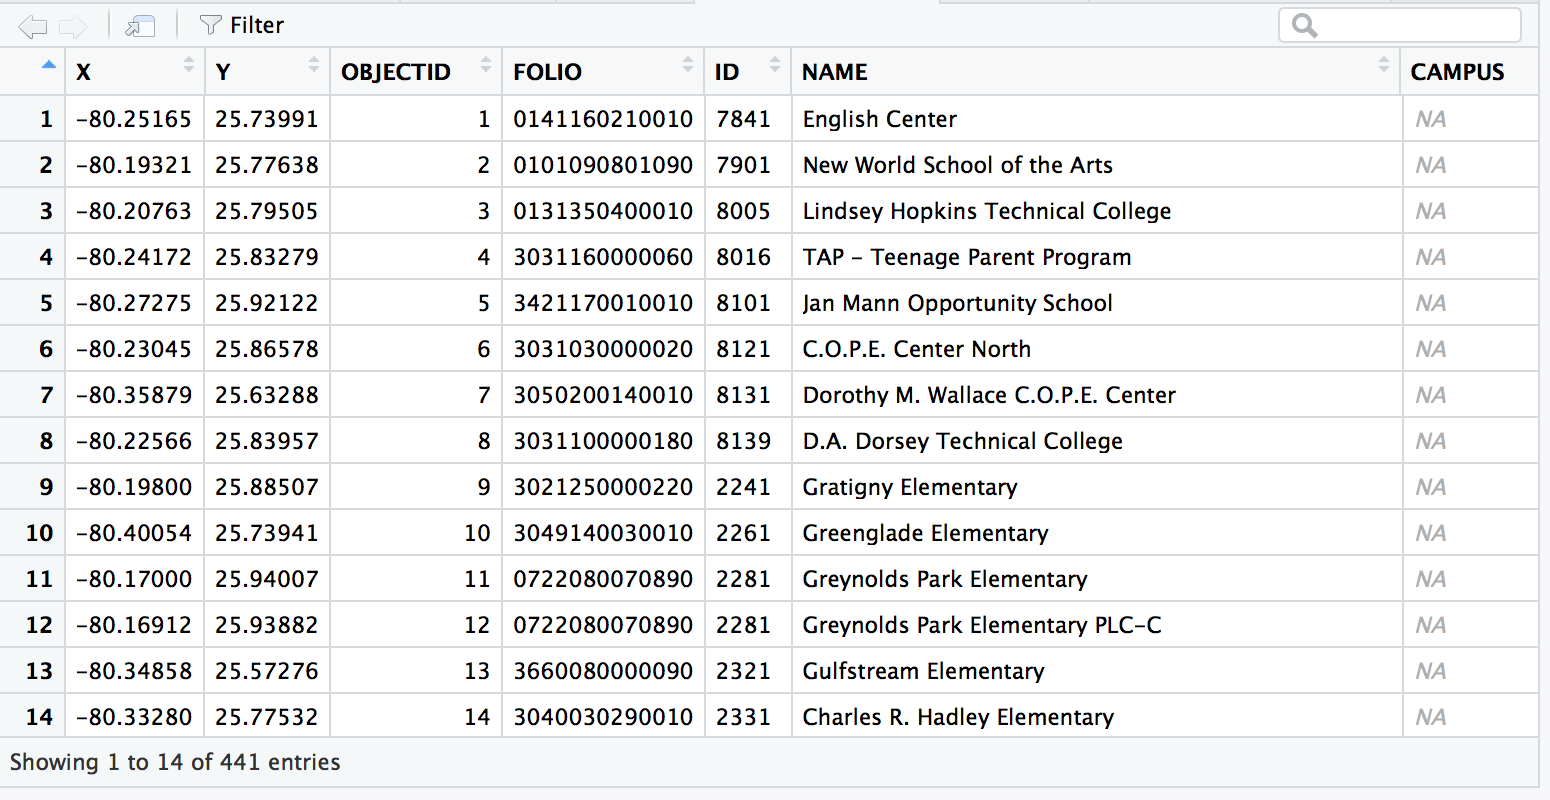
I can explore the data as if it were an excel spreadsheet, or I can look at the structure of the data by running the following commands.
colnames(Public_School)
rowname(Public_School)

The output tells me what features are available with the dataset. I would like to make a remark that the names of the features/columns. NAME THEM LOGICALLY. It takes 1 minute more of your time, but it will make for reproducible research or journalism.
Now we have a tiny problem. The names of the schools in this dataset don’t exactly match the names of the schools from the other dataset of free-reduced lunches…